Monday 21 January 2013

Common Agricultural Policy

The European Union launched the first version of its Common Agricultural Policy (CAP) in 1962.Its purpose is to set the conditions allowing farmers to produce food in a sustainable, safe and profitable manner.CAP had and still has five main objectives:
  1. Improving the profitability of agriculture
  2. Ensuring fair standards of living for farmers
  3. Stabilizing food markets
  4. Securing food supplies
  5. Ensuring reasonable food prices for consumers
The three guiding principles for CAP are common internal markets (the EU area is counted as one market), community preference (preferring food produced in EU) and common funding through EU budget. To give a perspective to CAP, here are some numbers:
  • There are 27 countries covered by CAP. They hold approximately 14 million farmers.
  • The farming and food sectors together provide 7 % of all jobs and generate 6 % of European gross domestic product.
  • In 2009, CAP had a budget of 58,9 billion euros
  • Annually CAP takes about 40 % of the whole EU budget

Through CAP, EU provides incentives to farmers to work in a sustainable and environmentally-friendly manner. While it looks good on paper, to farmers it shows as a huge load of bureaucracy and complicated details. The monetary support from EU to farmers is divided into global and local subsidies, which must be applied for separately, with separate forms and separate rules to follow.  Plans, follow-ups and reports must be made to prove that the rules have been followed. A whole industry of advicing farmers with the bureaucracy has sprung up. But when governmental subsidies are almost half of the income of a farmer (who sometimes can barely afford a minimum salary to himself), the monetary support is clearly vital for European agriculture.


Below is a short diagram showing how the CAP is maintained. European Commission is the highest authority, and draws the strategic lines for the whole EU area. EU agencies and the local agencies under it are last on the hierarcy, supporting the legislative and authoritative bodies in their respective countries.


More information:
http://ec.europa.eu/agriculture/cap-overview/2012_en.pdf
FAQ: http://ec.europa.eu/agriculture/faq/index_en.htm#2
Legislative procedure in the EU: http://www.europarl.europa.eu/aboutparliament/en/0080a6d3d8/Ordinary-legislative-procedure.html
NAT: http://www.eesc.europa.eu/?i=portal.en.nat-section
BBC Q&A: http://www.bbc.co.uk/news/world-europe-11216061
Draft for CAP budget 2011: http://eur-lex.europa.eu/budget/data/DB2012/EN/SEC03.pdf

Wednesday 16 January 2013

Variance analysis

DISCLAIMER: Statistics is scary. To ease the stress caused by writing and reading about it, I've included cute pictures along the way. One way of making statistics less traumatizing is to use funny examples, pretty colors or banging your head with a hammer, which is probably less painful than calculating regression factors. However, if you do read this post and end up in an insane asylum, try to get the room 7. I've hidden a hammer under the pillow.
 
Statistics is the science of controlling uncertainty in measurements and estimations. It's not just about collecting data and turning it to fancy graphs, but to really ensure that the information is correct. The graphs are just the tip of the iceberg of formulaes, tests and hypotheses. This post offers short explanations on some of the basic concepts of statistics. For more information, see KhanAcademy's excellent 10-minute videos on statistics.
A completely irrelevant but cute bunny.

Statistics: A branch of mathematics dealing with the collection, analysis, interpretation, and presentation of masses of numerical data. A collection of quantitative data. A statistic would be a single term or datum in a collection of statistics, or a quantity (as the mean of a sample) that is computed from a sample.(Merriam-Webster Dictionary)

Median, mean and mode: When the numerical values of the data are arranged from smallest to largest, median is the value in the middle, or the mean of the middle values (if there are even number of results). Mean is the arithmetic mean of the values: the sum of the values divided by the number of values. Mode is the value which is represented most often in the set of data. For example, in a data set of
2  4  4  5  6  7  7  9
the median is the mean of the two values in the center ( (5+6)/2 = 5.5 ), 4 and 7 are modes and the mean is (2+4+4+5+6+7+7+9)/8 = 5.5. Note that median and mode are not always identical.

Population and sample: Population is the all past, present and future realizations of the values of the object to be measured. A population of soda cans would mean all of the cans which have been produced, are produced and will be produced in the future. Population statistics can only be estimated from a small proportion of the population, namely a sample. We select a decent amount of soda cans, measure them, and estimate how well those results might represent the whole population.

Different statistical values for a population and for a sample are sometimes calculated a bit differently. The denotations also differ. Thus it is clear when the statistics are about an observed sample or estimated for a population.

Normal distribution: The most common distribution of values, where middle-range observations are the most common, and extremely small and large observations are rare. Many natural traits, like height or IQ, are normally distributed, especially when a data set of over 30 observations is used. Normal distribution is in the shape of a Bell-curve. A really useful attribute in a normal distribution are that it's symmetrical around it's central peak:
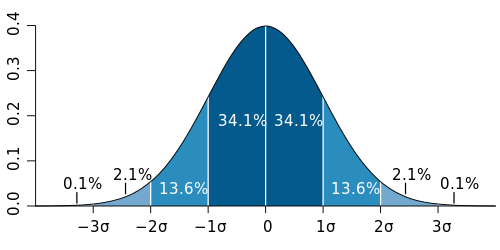
(c) Wikipedia

Variance and standard deviation: Variance shows how far each value in the data set is from the mean.Variance is relative, and independent from the values in the data set. It doesn't measure the difference between the mean and extreme values, but the distance between them in units of standard deviation. Standard deviation is simply the square root of variance. Population variance is often denoted as sigma to the power of two (σ2), and standard deviation as sigma (σ). Sample variance is mu to the power of two (µ2), and sample standard deviation is mu (µ).

Statistical testing: Testing in statistics is rather depressing: it's about estimating the risk of being wrong. First the research hypotheses are formed, and then the actual data is collected. A  set of two or more subsamples (or subpopulations) are compared by using either parametric or non-parametric statistical tests. The aim is to estimate the risk of being wrong when the formulated H0 (zero hypothesis) hypothesis is correct.

Variance? Is that something edible?
(c) redpandanetwork.org
H0 is always a "nothing happens" hypothesis, and H1 is it's opposite. Say that you've measured the weight of red pandas in two different regions in China. You calculate means, variances etc for the two samples (the two groups of pandas). Your H must be that there's no difference in the weights. Your H1 must then be either "There is difference in the weights", "the pandas in the area A are lighter" or "the pandas in the area A are heavier."


Variance analysis
 Variance analysis is a parametric test for comparing the mean of three or more subpopulations. The same comparation for two populations is done using a paired Student t-test. Variance analysis has three requirements:
  1. The populations in variance analysis  must be normally distributed
  2. Variances are equal in all subpopulations
  3. The observations are independent (not depending on one another)
The populations may be of different size. Usually the populations in variance analysis are caused by different treatments to the studied unit. For example, pieces of meat are treated with different preservatives to find the most effective one, or the  results of different excercise programs are compared. Again the zero hypotheses is that the treatments have no effect to the results ( µ1 = µ2 = ... = µn)


The structure of variance analysis is
xij = µ + αi + εij
where μ = common mean
αi = the effect of treatment i
εij = random error, which is normally distributed N(0,σ)

The idea behind variance analysis is to trace the variation in the observed results into separate sources. Variation can be caused by the treatments, or by other factors (residual error). If the assumptions for variance analysis are true, residual error is normally distributed with the expected value of 0. The total variation of the observations around the mean can be divided into two sums of squares, SStreatments and SSerror. The sum of SStreatments and SSerror is SStotal. SStreatments is the sum of squares of the variation caused by the treatments. SSerror is the sum of squares of the residual error.

In the formula above,
xij = the j:th observation of the i:th treatment
n = number of observations in a treatment
k = number of treatments
xi+ = sample mean in treatment i
x = sample mean of all observations


F-test
Once we've established the SStotal, it's time to use SStreatments and SSerror for estimating the population variance. The sums of squares must be divided by their degrees of freedom (df). For SStreatments df is k-1, and for SSerror it's kn-k. This gives us mean sums of squares. Finally the actual test value F is calculated:

MStreatments = SStreatments / k-1          MSerror = SSerror / nk-k

F = MStreatments / MSerror

The test value F is F-distributed with degrees of freedom k-1 and nk-k.  The larger F is, the stronger evidence it gives against the zero hypothesis. The critical values of F can be found from the F-sheet (such as this). The observed value of F is then used to find out the observed p (probability to get the observed results if H0 is true). If a test of significance gives a p-value lower than the significance level α, the null hypothesis is rejected. I.e if the observed p < chosen significance level, H0 is rejected.

More on variance analysis:
http://www.itl.nist.gov/div898/handbook/prc/section4/prc433.htm
http://www.terry.uga.edu/~pholmes/MARK5000/Classnotes2.pdf
http://en.wikipedia.org/wiki/Statistical_significance


Wednesday 9 January 2013

Useful links

Here are listed some links anyone interested in animal science and topics related to it might find useful. The list will quite likely expand later on.

DAD-IS, Domestic animal diversity information system
DAD-IS is the Domestic Animal Diversity Information System hosted by FAO. It is a communication and information tool for implementing strategies for the management of animal genetic resources (AnGR). It provides the user with searchable databases of breed-related information and images.
http://dad.fao.org/

Videos about animal welfare
FAO provides the public with myriad videos on animal welfare. The videos cover topics such as who's who in animal welfare, ethical issues, population management etc. 
http://www.fao.org/ag/againfo/resources/en/videos_AW.htm 

OMIA - Online Mendelian Inheritancy in Animals
OMIA is a catalogue/compendium of inherited disorders, other (single-locus) traits, and genes in 188 animal species (not including human, mice and rats) authored by Professor Frank Nicholas with help from many people over the years.
http://www.ncbi.nlm.nih.gov/omia

National Center for Biotechnology Information
The National Center for Biotechnology Information advances science and health by providing access to biomedical and genomic information. Find 3D images of proteins, information on DNA and RNA, genomes, maps, literature and powerful tools for analysing genomic data.
http://www.ncbi.nlm.nih.gov/

The Merck Veterinary Manual
Merck has created The Merck Manuals, a series of books for human and animal health care professionals and for the general public. As a service to the community, the content of The Manuals is available free of charge in enhanced online versions. The online versions are updated periodically with new information and contain illustrations and audio and video material not present in the print versions.
http://www.merckmanuals.com/vet/index.html

European Comission: Agriculture and Rural development
This site describes the common agricultural policy (GAP) in the EU, and lays out its policy areas, funding etc. 
http://ec.europa.eu/agriculture/index_en.htm

Essential Biochemistry
Essential Biochemistry, by Charlotte Pratt and Kathleen Cornely, is an introductory biochemistry textbook for college courses. It provides in-depth coverage of the most fundamental areas of modern biochemistry and is fully integrated with multimedia exercises incorporating animations and interactive molecular graphics.
http://www.wiley.com//college/pratt/0471393878/student/

Interactive concepts in biochemistry
Wiley's interactive animations for understanding the complicated reactions and processes in biochemistry. Includes quizzes, tutorials and web links. The site also features Nucleotides Game, which helps to recognize the different nucleotides by their biochemical structure.
http://www.wiley.com/legacy/college/boyer/0470003790/animations/animations.htm

RCSB Protein Data Bank
 An Information Portal to Biological Macromolecular Structures. The site offers tools to explore the molecules of biological processes that define life, offering plethora of information and tools for teachers and students alike.
http://www.rcsb.org/pdb/home/home.do

Khan Academy
Hundreds of free, easily understandable, approximately 10 minute videos on mathematics, chemistry, biology, history,  humanities, computer science etc. The topics of the videos cover basic courses in colleges and universities. Recommended for anyone, especially those who sit during the lectures just staring at the wall.
https://www.khanacademy.org/

GMO Compass
News, research summaries, reports and information on all the research on genetically modified plants in EU. Includes also reviews on the safety of GM plants, and updates on how different research projects are progressing. The site has also info on labeling, using and regulating genetically modified plants as food or feed.
http://www.gmo-compass.org/eng/home/

Molecular Farming
The use of transgenic plants for the production of recombinant proteins is called molecular farming (MF). It is a promising alternative for conventional production systems such as animal cell lines and microbial cultures. The site has information on the publications, target molecules, research, plans and participants related to MF.
http://www.molecularfarming.org/

WebCutter 2.0
Webcutter allows the user to input a sequence of DNA, and then shows all the possible restriction sites in that sequence. It shows silent and one-time cutter enzymes as well. Webcutter can analyse degenerate, linear and circular sequences, and it is based on the reliable NCBI's GenBank database.
http://rna.lundberg.gu.se/cutter2/

Lehninger Principles of Biochemistry
Online material related to the topics in the common course book Lehninger Principles of Biochemistry. This Web site is designed to help you review key concepts from your textbook. Some content requires you to log on, but a lot is available for everyone. The technique animations are especially useful for understanding complex techniques like PCR, DNA synthesis and cloning.

http://bcs.whfreeman.com/lehninger/default.asp