Sunday, 27 April 2014

Feeding dairy cattle


No matter what types of silage, roughage, concentrate and other feeds are used, dairy cows always need a minimum amount of fibre. Fibre is essential for the functions of the rumen, and a well-functioning rumen is the basis of a healthy, well-producing dairy cow. In a daily feed portion, 25-27 % of the dry matter should come from NDF-fibre in the roughage. Fibre not only affects the layering inside the rumen, but also increases ruminating and the amount of saliva excreted. Saliva keeps the pH of the rumen steady, and prevents acidosis.

Not all types of NDF-fibre are as effective. The particle size should be over 3 mm, but increasing the size over 6-10 mm doesn't increase ruminating any further. Fibre from roughage is more efficient than fibre in concentrate, mostly due to the difference in particle size. However, roughage with a high D-value can be low in fibre.Composition of the roughage is also important: legumes have less fibre than hay plants, and their NDF has a lower digestibility, even though the D-value is similar. Legumes and corn have about 150 g less NDF in a 1 kilogram of dry matter.

Crude protein
Dairy cows should get 130-140 g / 1 kg DM of crude protein (CP) daily. CP content higher than 140 g/kg DM is not utilized effectively, and increases N excreted in faeces. Studies show that cattle utilizes 0 % of  the nitrogen, when it added by using fertilizers high in N. In contrast, cows utilise 16 % of nitrogen in silage harvested early. Succesful fermentation and high D-value increase the CP value.

D-value
D-value describes the digestible portion of the organic content of the feed. Target D-value in hay-based feed is 650-690 (65-69 %). The earlier the silage is harvested, the higher the D-value is. When the D-value of a feed is high, adding concentrate increases milk yield only slightly. On the other hand, the impacts of poor D-value can only partially be covered by adding concentrate. Low D-value leads to low amounts of feed eaten, which lowers the CP, fibre and other nutrients received.

From the start of June, the D-value of hay in the first harvest decreases 0,5 % a day due to lignification.In the 2nd and 3rd harvests the decrease is much slower, but the feed values and amount of digestible fibre of late harvests are lower anyway. 


Feed ingredients

Ryegrasses
Italian ryegrass as more leaves and is more palatable than Westerwold ryegrass. The D-value of the Italian variety also decreases slower, but the plant grows more slowly and has more weeds in the 1st harvest than the Westerwold species. Westerwold is thus considered a better fir for fermented silage.

(c) www.herrinhs.org
Red clover
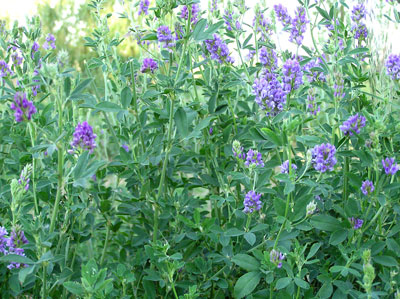
Red clover has a high amount of crude protein and is highly palatable, but may be difficult to store by fermentation. Is has less fibre than hay. Due to the high palatability animals eat red clover more than grass-based silage even though the clover had a lower D-value and less fibre. Red clover feed increases milk yield and the amount of unsaturated fats in the milk. It is recommended to be used together with grass- or hay-based silage. Note that red clovers are high in potassium, so grazing animals on pastures with plenty of red clover may lead to grass staggers.
(c) www.innerpath.com.au
Lucerne / alfalfa
The queen of crops, lucerne is the most important silage ingredient in the world. It is used as silage, dried and as pastures. Lucerne is very high in crude protein, so it should be mixed with hay or grass to bring the CP down to a reasonable level. Lucerne also has lower fibre content and lower digestibility than hay, which are compensated by higher palatability. Compared to red clover, lucerne affects milk yield as well as or even better than red clover.

Straw
The gross energy of straw is high, but due to extremely low digestibility it yields practically no energy to the cow. Straw in a whole crop silage has more energy and higher digestibility than that of a fully ripened crops.  It is mostly used to increase the fibre content especially for dry cows and heifers. Straw is also very good for beed cattle fed with high amounts of concentrate, and for suckler cows. Straw is not necessary for cattle fed with hay- or grass-based silage.
whole crop silage
(c) takakita-net.co.jp
Whole crop silage
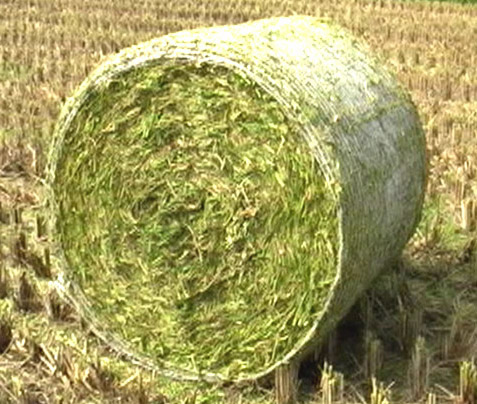
Wheat and barley are the most used species, because they have the highest palatability. Oat has a lower digestibility, and is used mostly for dry cows and heifers. Rye is palatable only if harvested early, but even then it is usually too expensive to be used for cattle feed. Whole crop silage can be used alone or together with grass- or hay-silage to offset the high crude protein content of the silage.

Harvesting of whole crop silage must be considered carefully. If it is harvested too early, the feed has low dry matter content and low digestibility, and may be difficult to preserve by fermentation. Late harvesting causes losses due to shedding, and the feed does not ferment. In addition to harvesting, the crops used and their properties impact the quality of whole crop silage.

Peas. (c) TerraLink
Pea
Peas have plenty of crude protein, and are best used in together with whole crop silage. Growing pea together with grains reduces the need for nitrogenous fertilizers and increases the protein content and digestibility of the silage. However, shedding losses may be noticeable, and peas are difficult to preserve by fermentation. Peas are annual plants and the seeds may be expensive, but if the harvesting is done well, the yield is high.

(c) Suomen Rehu
Commercial concentrates
Concentrate is used to increase the amount of one or more nutrient in the feed mix. Energy feeds and protein feeds are the most common ones used, but minerals and vitamins are also often part of concentrates. The impact of increased protein and energy on milk yield is limited, and can be minimal if the D-value of roughage is high. Too high amounts of concentrate reduce the amount og roughage eated, which again reduces the amount of fibre gained, and leads to bloat and acidosis. A commercial "full concentrate" has no grains, and contains usually 30-45 % CP and 10-11 ME MJ. A "semi-concentrate", which includes grains, has 23-30 % CP and 12-13 ME MJ.

More information

Dairy animal nutrition by Penn State University

Other posts in this blog about animal nutrition:
Feeding beef cattle
Feeding poulty
Legumes, rapeseed and grains in pig production
Determining feed digestibility
Value, quality and preservation of silage


Saturday, 26 April 2014

Synthesis and composition of cow's milk

Alveoles of the udder.
(c) Sjaastad et al., Scanvetpress
Cow's udder consists of four independent mammary glands, which each have one teat and one opening. Milk is produced in alveoles. Each alveole contains 0,01 ml of milk, which is secreted from the epithelial cells. Once the alveole is full, myoepithelial cells outside the alveole constrict and push the milk into the milk duct, and milk chamber. All in all the udder of an adult cow weighs 10-30 kg, and has 5-20 milk ducts which branch out to smaller milk ducts. The ducts end in lobes, which are filled with alveoles in smaller lobules. The udder needs 400-500 liters of blood to absorb enough nutrients for a kilogram of milk.

Udder development (mammogenesis) begins during the embryonic development. During the first three months of gestation the embryo develops teat channels, milk chambers and initial mammary glands. Actual ducts, teats and fat pads to protexct the udder are formed before the calf is born. From birth until 3 months of age the udder develops isometrically, i.e. as fast as other tissues. Between 3 months and 1 year of age the udder develops allometrically, i.e. faster than other tissues, and then returns to isometric development. Too heavy feeding before puberty decreases the amount of secreting tissue and reduces milk yield.

When the heifer is in gestation, the udder development continues. The ducts grow and increase during the first 3 months, and later the portion of the secreting tissue increases. 10 % of secreting milk ducts develop only after calving, which causes the lactation peak about 2 months after calving. After the peak the number of alveoles begins to decrease. The decrease is faster if the cow gets pregnant again.

Lactogenesis is the actual synthesis of milk, which cab begin once the cow has reached puberty. 0-4 days before calving the amount of progesterone in the body decreases but prolactin and glucocorticoids increase. This signals the body to start producing alpha-lactalbumin, a gene which starts the lactose synthesis in the Golgi apparatus. Lactose changes the osmotic pressure of the udder and thus draws water into the udder. The maintenance of milk production is called galactopoiesis. Prolactin is a hormone which is secreted during milking, and increases the metabolism of the epithelial cells of the milk alveoles. Insulin-like growth factor IGF-1 maintains galactopoiesis and increases milk yield. This is why some countries allow synthetic IGF-1 called BST, Bovine Somatotropin, be injected into the cows to force their metabolism to produce even more milk.

The components of milk are synthetized in different parts of the mammary gland. Lactosis is synthesised in the Golgi apparatus from glucose and VFAs in the blood stream. Lactose is the main component which determines the amount of milk produced. Fats of the milk are synthesized in the cytoplasm from VFAs other fatty acids. Milk protein is synthesised in ribosomes from amino acids absorbed from the blood stream. Minerals and vitamins are secreted into milk directly from the blood stream.

Composition of milk

On average, 87 % of milk is water, 3,25 % is protein and 3,9 % is fat. The rest is a variaety of minerals, trace minerals, vitamins, acids, enzymes and gases. 95 % of the nitrogen in milk is in proteins, the rest is in urea, ammonia and creatine. The composition is affected by several factors:
  • Breed: Jersey cows produce milk with higher fat and protein content than ayrshires or Holsteins.
  • Phase of lactation: fat and protein content increase towards the end of the lactation. Also right after calving the colostrum is rich in fat and protein,
  • Milking technique: Incomplete milking leaves the fatty milk inside the udder. and long intervals (over 16 hrs) between milkings decrease milk yield.
  • Udder health: during mastitis there's more Cl and Na in the udder, and less K.
  • Somatic cell count: the higher the count, the lower quality the milk has. Excellent milk has less than 250 000 somatic cells in a 3 mth average geometrical calculation.
  • Proportions of the VFAs released from the rumen: butyric acid increases fat synthesis, acetic acids maintains it and propionic acid decreases it while increaseing protein synthesis.

Effect of diet on milk production
(c) Babcock Institute e-learning
Feeding is a very important factor in determining the milk yield and the composition of milk. Generall,  high energy intake decreases fat and protein synthesis due to the increase of propionic acid synthesis. However, if the high energy content is due to highly digestable roughage, then fats and proteins in the milk may be increased. Highed energy content generally increases protein synthesis due to increased energy available for the rumen microbes.
  • Adding silage or concentrate: increases protein synthesis, decreases fat synthesis
  • Adding protein to the food:Same as above, increases the amount of urea in the milk.
  • Adding fats to the feed: decreases protein synthesis, may decrease fat synthesis
  • Better digestibility of the roughage and limiting the fermentation of the roughage: increases fatty acid and protein synthesis. Protein synthesis is increased more than fatty acid synthesis.
  • Using hay or legumes in grass-based roughage decreases protein synthesis. However, especially red clover increases milk yield (~1,4 kg / d)  and protein & fat synthesis, but due to the increased yield the percentage of both fat  and protein in the milk is decreased (-1,5 g/kg and -0,4 g/kg, respectively).

Grazing on a pasture also affects the composition of milk. During grazing season the amount of unsaturated fatty acids in the milk increase due to the composition of grass versus fermented roughage. The relatively high fat content of grass disturbs the biohydrogenation of the rumen, which leads to less fatty acids being saturated. Protein content of milk decreases during grazing. In countries where cows graze only during summer there is clear annual changes in the composition of milk. Both protein and fat content decrease during the summer, and increase again once the cows are moved back indoors.


More information

Dairy Education Series by Professor H. Douglas Goff, Dairy Science and Technology Education Series, University of Guelph, Canada.

Dairy Essentials by Babcock Institute for International Dairy Research and Development, University of Wisconsin-Madison, USA.

(c) Zweber family farms


Tuesday, 22 April 2014

Basics on animal genetic resources

Farm animal genetic resources, or simply AGR, refers to the genetic material we currently have in live animals and frozen in sperm banks, and which is of economical, cultural and scientific importance. Genetic diversity, both within and between breeds, is vital. Diversity
  • helps the animals to adapt to their environment
  • is the basis for animal breeding
  • allows adaptation to changes and new breeding targets
  • prevents inbreeding depression
  • keeps the frequency of harmful allelels low.
Domestication has already reduced genetic diversity in farm animal species (and artifical insemination has reduced it even further). Domestication is the process by which captive animals adapt to man and the environment provided, and it is achieved through genetic changes. Genetic factors affecting domestication are inbreeding, genetic drift and selection.  

Impact of domestication on milk yield of dairy cows.
Inbreeding is necessary when selecting a desired trait, but it reduces heterozygosity and thus diversity, although it does not affect allele frequencies. Genetic drift causes alleles to become fixed or deleted randomly, and its direction cannot be estimated. Selection, both natural and artificial, has altered the fitness of certain traits. For example, in domestication species the distance to flee and fearfulness have been decreased, even though they are vital for a wild animal. These are both behavioral changes. Physiological changes involve changes in hormone levels, reproduction cycle and production traits (e.g. the increased milk yield of cows and the all-year farrowing of sows). Morphological changes have also occurred, as animals have grown larger and developed colors unseen in the wild (especially white). For an example of scientific study on domestication, see Giuffra et. al (2000) or Kantanen et al. (1999).

Studying domestication

Domestication can be studied in several methods. Paternal transmission of Y-chromosome shows traits have developed from sire to offspring. It's counterpart is the study of mtDNA (mitochondrial DNA), which is always inherited from the dam to all her offspring. mtDNA haplotypes are sequenced and aligned, and dendrograms or cladograms are drawn based on the multiple-sequence-alignment (MSA) results. The haplotypes can be further divided into groups, which helps to draw a network. For more information visit the blog The Genealogical World of Phylogenetic Networks and their post on interpreting rooted networks.

The most common method by far is still studying microsatellite markers. Usually 20-30 microsatellites are studied, but FAO has published recommendations for each animal species (FAO). Polymorphic loci with 4 or more alleles are recommended to eliminate false positives by identical-by-state -alleles. Unlike mtDNA and Y-chromosome, microsatellites are inherited from both parents to all offspring. Genotyping and aligning SNP-markers is similar to microsatellies, but requires the use of thousands or hundreds of thousands of SNP-markers. Microchip arrays are readily available for several species for SNP-analysis.

Practical application of genetic domestication studies.
(c) ILRI 2006

Studying ancestral DNA is tedious, but can yield valuable information on extinct species. Ancestral DNA can be thousands or tens of thousands of years old. It is collected either from animal remains such as fossils, teeth, wools, hides or bone pieces, or from the ground ("dirty DNA"). Ancestral DNA also helps to chart the spread of different animal and plant species and to determine temporal changes in their genetics. The problem with ancestral DNA is that the concentration of desired DNA is often low, while the concentration of microbial DNA is high. Contamination risk is very high indeed. Sterile environment must be maintained whenever possible when working with ancestral DNA. Another problem is that the ancestral DNA has been fragmented, and many chemical bonds have been broken. C > T and G > A mutations in PCR are common due to deamination. The results must be confirmed in several independent laboratories. In addition, all results derived from ancestral DNA must fit in to earlier context.

Retroviruses have been used as a study method on sheep. Retroviruses are viruses, which insert their RNA to the sheep's system, and with reverse-transcriptase produce DNA from the RNA. The viral DNA is then integrated as a part of the sheep's own genome. The viral DNAs which have infected germline cells are hereditary, and thus provide a tool for studying the evolution of sheep. The original virus infections happened 5-7 million years ago, and have continued to branch even during the last 10 000 years. Studies of retrovirus-DNA has shown that originally all sheep in Europe were used for meat production. A meat-and-wool producing breed was introduced later,  and replaced the old breed nearly completely. Still existing breeds originating from the first migration are Soay sheep, Gutesheep and Finnsheep.  

Determining the level of endangerment and the value of a breed

There are thousands of animal breeds in the world. FAO's DAD-IS -information system classifies breeds into four categories:
  • local breeds, which exists in one country or area only
  • transboundary breeds, which exists in several countries
  • regional transboundary breeds, which exists in several countries but only in one continent
  • international transboundary breeds, which exists in many continents.
Each breed is also classified based on the level of endangerment. There are five levels, which are determined by the population size and number of breeding males and females. Other classification systems also consider the direction of population size (growing or decreasing), the purity of the species and the number of populations (e.g. herds). FAO's five levels are
  1. Extinct
  2. Critical (with or without a conservation program)
  3. Endangered
  4. Not at risk
  5. No information on the population size.
Currently DAD-IS lists (among others) 3093 cattle breeds, 2558 chicken breeds/lines and 1283 pig breeds. Altogether there are 14544 breeds listed for 38 animal species. Of the listed local cattle breeds, 181 are extinct (209 in 2006) and only 399 are not at risk. For pigs there are 110 extinct breeds (140 in 2006) and 206 not at risk. The numbers from the year 2006 are larger, probably due to renewal of the concept of breed or improved methods of separating breeds and collecting information. Below are a few examples of the tables created from DAD-IS system, showing the status of cattle, pig and sheep breeds in different regions.

The level of endangerment is the likelihood of the breed going extinct in the current circumstances within a certain time period. It can be used to estimate how much there is time to save a breed. The level depends on demographic factors (population size and its changes) and genetic variation. Genetic variation is calculated from effective population size Ne, which again is deduced from the change of inbreeding (Ne = 1/2 ΔF). Growth factor can be calculated from r = anti-log (( logN2–logN1) / t ), where N1 and N2 are the population size at two different measurements (generation 1 and 1+n), and t is time in years. The growth factor depends on animal births and deaths, cullings, changes in market prices and agricultural politics and on epidemics.

Method of estimation impacts the value of  ΔF. Pedigree-based studies give consistently lower estimated of ΔF than SNP-based evaluation. In one study, pedigree analysis found that 15 % of animals had F > 6.25 %, while in an SNP-study the percentage was 25 %. For pairwise kinship coefficients both methods are equally reliable for close relatives. For more distant relatives the pedigree analysis gives higher estimates than SNP-analysis. (Li et al. 2011)

However, Ne, ΔF and the growth factor are only single meters. To estimate the value of a breed for genetic conservation requires a more holistic approach. In addition to the meters mentioned before, the breed value depends on several factors. The factors, and examples related to them, are listed below.
  •  its ability to adapt to a certain environment (Yakutian cattle, goat breeds in arid African countries)
  • economically important traits (the excellent cheese-making qualities of the milk of Finncattle)
  • unique traits (breed-specific mutations, alleles and gene combinations)
  • cultural heritage, historical value (Yakutian cattle)
  • unique genetics.
One must remember that the breed must be able to cope even in the future, and to continue being useful for the herders. It is not a viable option to maintain breeds which cannot survive for example after global warming or if their surroundings change due to industrialization. 

Yakutian cattle (c) EPFL / Anu Osva

Thursday, 13 March 2014

Genetic analysis

XKCD's take on genetic analysis.
Genetic analysis may sound complicated, but it relies on very simple principles of heredity, statistics and probabilities. Sometimes the genotypes are not known at all, and we need to look at pedigrees to determine models of heritance. Here some basic principles of genetic analysis are discussed. Later on a post on bioinformatics will make a deeper analysis on how to analyze known genes an genomes.

Calculating probabilities

Inheritance, or which genes each parent passes on to the offspring, is always partially random. This is why probabilities are important. For example if we know the absolute frequency, i.e. the number, of a certain allele in a sample, we can deduce the probability of one randomly picked individual having that particular allele. Set the absolute frequency of the allele a to 118. Now we know that there are 118 a alleles in our sample of 500 chromosomes. The probability of a random individual to have a is simply the amount of a divided by the number of all possible alleles: 118 / 500 = 0,236. This is also the relative frequency of a.

So, the probability of A, whatever A is, is P(A) = the number of favorable results / the number of all possibilities. The probability of A's complement, of A not happening, is 1- P(A). Combinations of two or more independent variables are calculated as follows: P(A and B) = P(A) * P(B) and P(A or B) = P(A) + P(B). An example of a complement: if a chromosome has the allele a, it cannot have the allele A. Only either one or the other (barring some rare genetic mutations, which are not considered here).

The probability of two separate outcomes depends on if the outcomes are related or not. A union means that either (A or B) or (A and B) happen. For independent variables the union would be P(A) + P(B) - P(A u B). For dependent variables the union is zero: if A has happened, B cannot happen, or vice versa.

To ease your stress, here is a cute animal.
The conditional probability, the probability of A happening when we know that B has already happened and A and B are dependent, is (P(A) * P(B)) / P(B). This is often marked as P(A|B).

Permutations and combinations deal with the order of several possibilities. Permutations are used when the order of the events is important, and is counted as n!. Combinations take all orders into consideration, and are counted as n! / (r! (n-r!)).

Binomial probability is a bit more complex. It is used when we want to determine the probability of getting exactly r favorable results, each with the probability of p, out of n repeats. The magic word here is exactly - when that is used in an exercise, think of binomials.

More on probabilities:
For the mathematically gifted: Wikipedia 
Cut the Knot (also covers Bayesian methods)

Statistics

Statistics have been covered before in a post named Variance Analysis (one of the most popular posts in this blog!), so I'll just remind you of the formulae we will need when doing genetic analysis.


There are thousands of helpful websites you can look up for more information on statistics. Here are just a few:

Statistics.com
Mendelian genetics by Phillip McLean

Examples

Right, let's get down to the real deal and do some analysis! The examples are from University lecture materials for course in genetic material, but I unfortunately cannot share the entire material due to copyright restrictions and a language barrier - the materials are not in English :)

Example 1. Parents are heterozygotic concerning their eye color. They both have the allele s for blue eyes and the allele S for brown eyes. Calculate the probability that they will have 
a) a child with blue eyes  b) five children with blue eyes.

From the way the alleles are written we see that S is the dominant allele. The genotypes of the parents are Ss and Ss, so the possible genotypes of their children are 

Now we can see that 3/4 of the offspring have the dominant allele, so only 1/4 has blue eyes (homozygote ss). Therefore the P(a child has blue eyes) is 1/4 = 25 %. The probability for each subsequent child is similar, so P (five of five children have blue eyes) is 0,25 * 0,25 * 0,25 * 0,25 * 0,25 = 0,000977.


Example 2. 32 % of people infected with a rare illness have mutation A, and 16 % have mutation B. 10 % of those infected have both A and B. Calculate the probability of randomly selected person to have at least one of the mutations? 

The selected person must now have either A or B or both. What is needed is the union of A and B: P(A) + P(B) - P(A u B) = 0,32 + 0,16 - 0,1 = 0,38. 38 % have either A, B or both mutations. Note that the union P(A u B) is NOT A*B in this case, but it is given as 10 %.

Example 3. There are 2 boys and 5 girls in a family. In how many different sequences could the children have been born? 

Because the order is not important, we'll use combinations: n over r, i.e. n! / r!(n-r)!. The n now is 7, the number of all kids. The r can be either 2 or 5: both give the same result. If r = 2, then 
7! / 2!(7-2)! = 7! / 2! 5! = 5040 / 240 = 21.

Example 4. Parents are heterozygotes concerning a rare recessive illness. Calculate the probability that out of three children
a) all are healthy
b) two are ill
c) at least two are ill.

a) Recessive heterozygotes produce 25 % of recessive homozygotic alleles (see example 1). The probability for each child to be healthy is thus 1 - 0,25. P(all are healthy) = 0,753 = 0,422.

b) Two out of three must be ill, so we need the binomial distribution. Now r = 2, n = 3 and p = 0,25. The first factorial, n over r, gives 3!/2!(3-2)! = 3. Continuing from there we have 3 * 0,252 * (1-0,25)3-2 =3 * 0,0625 * 0,75 = 0,141.
c) If at least two must be ill, then the probability is P(two are ill) + P(three are ill). The first part is calculated like in part b: 3 * 0,252 * (1-0,25)3-2 =3 * 0,0625 * 0,75 = 0,141. P(three are ill) is simply 0,253 = 0,015625. So P(at least two are ill) = 0,141 + 0,015625 = 0,156. 

Example 5. The penetrance of a certain illness varies between genotypes. The penetrances are 0,01 for AA, 0,05 for Aa and 0,5 for aa. In a population the allele frequencies are  f(a) = 0,05 and f(A) = 0,95. The population is in Hardy-Weinberg equilibrium. Count the prevalence of the illness in the whole population.

Whoa, lots of terms here! Penetrance is the probability of expressing a certain trait. Here the trait is the illness. H-W balance means that in an ideal population, where q and p are the relative frequences of a alleles, there are p2 dominant homozygotes, 2pq heterozygotes and q2 recessive homozygotes. What are they actually askingfor is the prevalence, i.e. the probability of a random member of the population to have the illness.

First we need to calculate the frequencies of the genotypes in the population. With the H-W equilibrium and the given frequencies we know that p = 0,05 and q = 0,95. Now the genotype frequencies are  
AA  = dominant homozygotes = p2 = 0,952 = 0,9025
Aa = heterozygotes = 2pq = 2*0,95*0,05 = 0,095
aa = recessive homozygotes = q2 = 0,052 = 0,0025

Now each genotype has its own probability of actually expressing the illness. To make it easier to understand we can build a table of  a tree of probabilities:


So now the random person we select has a 0,9025 % chance of having the genotype AA, and then 0,01 % chance of being sick.  Note that these variables are independent (a person can only have one genotype and be either sick or healthy). The possibility of expressing the illness is thus P(has a certain genotype) * P(is sick).

P(is sick) = P (AA and sick) + (P Aa and sick) + P(aa and sick) = P(0,9025 * 0,01) + P(0,095*0,05) + P(0,0025*0,5) = 0,009025 + 0,00475 + 0,00125 = 0,015.

Example 6. The observed genotype frequencies in a population are f(AA) = 31, f(Aa) = 89 and f(aa) = 122). Is the population in Hardy-Weinberg equilibrium?

If we were mean about it, we'd say no because no actual population is ever in H-W equilibrium. However in an exam we'd get 0 points for that, so let's calculate this. Now we need to use x2 or khi squared test. We already have the observed frequencies. Now we need the expected frequencies, i.e. the frequencies if the population was in H-W equilibrium.

To get there we calculate the allele frequencies in the population. There are 31 creatures with two A alleles and 89 with one. In total we then have 2 * 31 + 89 = 151 A-alleles. The recessive allele a is calculated similarly: 2*122 + 89 = 333. In total there are 151 + 333 alleles, so the relative frequencies are 151/484 = 0,312 for A and 1-0,312 = 0,688 for a. So now p = 0,312 and q = 0,688.The expected absolute genotype frequencies are now
AA  = p2 = 0,3122 * 242 (the size of population) = 23.56
Aa = 2pq = 2 * 0.312 * 0.688 * 242 = 103.89
aa = q2 = 0.6882 * 242 = 114.55


We need to calculate the chi squared test value using the formula

To make it easier, let's put our values to a table. Then we can use the formula and calculate the x2 test variable.


The value 4.97 is not the answer. Remember the question: is the population in H-W equilibrium? The answer hides in a x2 distribution table. To use that we need degrees of freedom (df), which in an chi squared good of fit test is the number of classes minus 1. Here we have three classes (three genotypes), so our df = 3-2 = 1. Now we look at a x2 distribution table such as this.


With df = 2 we find that our  x2-value, 4.97, goes between 4.605 and 5.991. The corresponding P-values are 0.10 and 0.05. So our p is 0.1 - 0.05. Without going too far into interpreting p-values we can just note that it is higher than 0.05 which means that we abadon the hypothesis 0 (the population is in H-W equilibrium). P > 0,05 shows us that the population is NOT in H-W equilibrium.

Friday, 21 February 2014

Beef production: Rearing systems and feeding

Beef is produced from dairy breeds and beef breeds, which can reside either in farms focused on dairy, beef or both.There are several options, which are all discussed in further detail.

Dairy breeds

Ayrshire calf
On a dairy farm the focus is on milk production. In the first option the farmer keeps only the dairy cows, heifers and calves which they will use for milk production. Less promising heifers and cows may be inseminated using beef breed semen to improve the carcass weight of their calves. Bull calves and other unwanted calves are sold to a calf rearing farm at the age of 1-8 weeks. Unwanted heifers and old or poorly producing cows are slaughtered.


On another rearing system calves are sold to the beef producer at a later stage, at the age of 2-3 months.

Some farms produce both milk and beef.  In this case all calves are reared on the farm until slaughter.  The farmer may buy more beef calves from surrounding farms. Dairy breed calves are kept for milk production, while beef breeds and less promising dairy breed animals are used in beef production.

Calves are most often reared using a three-phased method. The first phase is when the calf is born, and spends its first 10-26 days on the farm it was born in. Then it is sold to a rearing farm. The calves stay on the 2nd phase until their teens. The rearing time depends on the growth of the animals: in Northern Europe, the 2nd phase lasts 4-6 months. The farmer aims at daily growth of 900g and a mortality less than 4 %. The third phase is the finishing phase. Here the calf is reared until it's ready for slaughter. Finishing phase lasts 12-16 moths, and aims at animals weighing 350 kg. The animals are kept in groups in 15-30. When possible, each group is send to slaughter at the same time, and groups are kept steady to prevent fights.

Beef breeds
Ayrshire x Simmental -calf
Beef breeds are reared on a beef farms, which tend to be more extensive than dairy farms. Dairy animals are kept mainly indoors and fed heavily to promote milk production, while beef cattle is kept outside in paddocks. Feedlots especially in the Northern America are a concerning example of a production system, which is both extensive and intensive.

There are three types of beef production farms. Calf producers focus on keeping dams, who produce up to 10 calves during their lifetime. The calves are sold to a rearing farm, which is the second type of beef production. The third type is a combination farm, where the calves are bred and reared until slaughter.

Usually all breeding cattles, where the main target is to improve the genetics of the animals, are combination farms. In another option the calves are weaned and sold to a finishing phase farm. Here the animals are reared for 8-16 months, when they are sent to slaughter. The targeted live weight of animals depends on the breed, but ranges between 340-440 kg. The finishing phase farms usually accept only animals which are at least 75% beef breed.

Feeding

In beef production calves may be kept under their dams for 4-6 months, in which case weaning is a slow and natural process. If the calf is weaned from its mother sooner, usually during the first few days, one has to consider best methods for feeding the calf.

There are several options for feeding calves after the first few days of their lives, when they must be fed with colostrum.  Full milk is the most natural option, where calves get the milk which cannot be sent to the dairy. Liquid feeds are another option. the digestive tract of calves under 2-4 weeks of age does not secrete amylase, pepsin or rennin enough to be able to utilize vegetable fats or vegetable proteins. They can only utilize milk protein (casein), lactose and fats. After 4 weeks the calf
Their feed must have casein or whey protein and animal based fats. Water, hay and concentrated feed should be freely available at all times to support to development of the digestive tract.

Calves can be fully weaned from milk once they ingest at least 1 kg of silage a day. This happens usually at the age of 8 months, when the size of the rumen has changed from 30 % to 70 %, and in proportion the omasum and abomasum have shrunk from 70% to 30 %.

Distribution of energy from feed.
Growing cattle need energy, proteins, fat and water to maintenance and to production (see the picture on the left). The energy need for maintenance is measured as a BMR, basal metabolic rate. It includes the energy need for
  • breathing
  • blood circulation
  • molecular synthesis to balance natural catabolism of tissues
  • moving and using substrates in cells
  • contraction of muscle cells, transfer of nerve impulses
  • maintaining body temperature
Factors affecting the energy need for BMR are age, gender, breed, earlier energy status (prolonged malnutrition decreases BMR) and physiological status (is the animal for example in gestation or suckling its offspring). BMR is measured either direcly with a calorimeter or indirectly in a respiration chamber by calculating how much oxygen the animal uses, and much nitrogen and carbon dioxide it produces. The amounts of gases (liters / day) are then inserted to the Brouwer equation:
16,18 * O2 +5,16 * CO2 - 2,42 * CH4 - 5,90 * N in urine (g/day)

For growth, beef breed bulls need on average 10-27 MJ energy / day. A small bull growing 1 kg a day needs 10-15 MJ, while a bull putting on 1,5 kg a day needs 18-27 MJ a day and over 200 grams of protein a day. Castrated bulls (oxes) and heifers utilize energy less efficiently than bulls, and tend to grow slower and have a larger fat percentage than intact bulls.

Protein


Cattle get protein from two sources: from feed protein which has passed the rumen, and from rumen microbes. Both types of protein are metabolized in and absorbed from the small intestine. Therefore the animal's need for protein can be expressed as a need for protein absorbed from the small intestine. Another measurement is the protein balance of the rumen, which measures the amount of protein in the feed compared to the microbe's ability to utilize it. If the balance is negative, the microbes do not get enough protein from the feed. In a positive balance the microbes can utilize only a portion of the proteins, and often proteins pass through to the faeces. The balance is not calculated for animals weighing over 200 kg, for their rumen microbes are developed well-enough to withstand even a slightly negative balance.

The metabolization and utilization of protein is described in the picture below. Protein is originally acquired from feed. Undegraded protein, or unmetabolizable protein, is passes through the rumen to the small intestine, where a portion of it is metabolized and absorbed. The rest is exreted as faeces. Metabolizable protein is used by the rumen microbes, which in turn die and are passed to the small intestine. Major part of the amino acids in the microbes are metabolized, absorbed and used as tissue protein (or milk, if the animal is lactating).


The metabolization of protein in the digestive tract of a cattle. Original source unknown.

Sources for information on feeding: 

ARC1980. Agricultural Research Council. 1980. The nutrient requirements of ruminant livestock, technical review.

AFRC1990. Agricultural and Food Research Council. 1990. AFRC Technical Committee on Responses to Nutrients , Report Number 5, Nutritive Requirements of Ruminant Animal : Energy. Nutr . Abstr . Rev.(Series B): 60: 729 - 804

Dryden , G. McL . 2008. Animal Nutrition Science. www.gabi.org


Sunday, 16 February 2014

Beef production: Breeds and beef quality

Beef cattle are generally sturdier, meatier and larger than dairy breeds. In addition, they may have stronger maternal instincts, because in several systems the dam suckles her calves for several months. In dairy farming, calves are usually taken from the dam within 24 hours from birth. The information here is referenced from the website of Oklahoma State University and from other sources.

Angus or Aberdeen Angus is a medium-sized beef breed with either black or red coloring. Grows slower and gains fat faster than larger breeds.
Size (cows): 650-850 kg
Size (bulls): 1000-1300 kg


Belgian Blue has a mutation, which causes it to be double-muscled. The extreme size of its muscles causes severe problems when calving, and most cows must undergo several cesarean sections during their lives.
Size (cows): 700-850 kg (source)
Size (bulls): 1100-1250 kg

Blonde d'Aquitane, or blond, is a muscular and docile breed.
Size (cows): 700-900 kg
Size (bulls): 1200-1400 kg


Charolais is a white or cream-colored, large beef breed from France. It grows fast and generally gains fat slower than smaller breeds.
Size (cows): 700-950 kg
Size (bulls): 1200-1400 kg


(c) http://yallaroo.murrayfrancis.com/

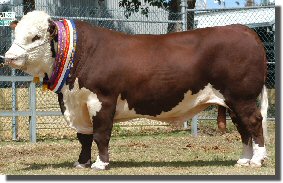
Herefords are massive, red and white colored animals. The head is usually entirely white and covered in curly, thick fur. Grows slower and gains fat faster than larger breeds.
Size (cows): 600-850 kg
Size (bulls): 1100-1300 kg


 Simmental is colored much like the Hereford, but the head is usually not entirely white. It is originally from the Simme Valley in Switzerland. It grows fast and generally gains fat slower than smaller breeds.
Size (cows): 700-950 kg
Size (bulls): 1200-1400 kg


Limousin  is another French beef cattle breed, and has originally been used as a working animal as well as for beef production. It has a high carcass percentage, i.e. the ratio between carcass weight and live weight. It grows fast and generally gains fat slower than smaller breeds.
Size (cows): 650-850 kg
Size (bulls): 1100-1300 kg


Carcass quality

Beef quality starts from carcass quality. A carcass is more valuable the less fat and bone is has, as the meat is the only economically important portion. The measurements are subjective, and based on the shape of the carcass. Most valuable cuts are evaluated especially carefully. In the European Union carcass quality is measured in an europ-scale: S > E > U > R > O > P (EEC  1208/81):

  • S (superior) = All profiles extremely convex; exceptional muscle development (double-muscled carcase type)
  • E (excellent) = All profiles convex to super-convex; exceptional muscle development
  • U (Very good) = Profiles on the whole convex; very good muscle development
  • R (Good) = Profiles on the whole straight; good muscle develop- ment
  • O (Fair) = Profiles straight to concave; average muscle develop- ment
  • P (Poor) = All profiles concave to very concave; poor muscle development
In addition to the EUROP-scale, the fatness of the carcass is evaluated from scale 1 (fat-free) to 5 (extremely fatty).

Two important concepts to consider are live weight and carcass weight. Live weight is the weight of the entire animal. Carcasss weight is live weight minus the weight of the head, genitalia, udder, digestive tract, internal organs, hide and hooves. The ratio between carcass weight and live weight is called carcass percentage. Carcass percentage varies between breeds, but is commonly 50-60 %.

When the carcass weight increases, to which the farmers often aim at, the relative proportion of lean meat decreases. In proportion, the amount of fat increases. The portion of the most valuable cuts (steak and filet) from the entire carcass does not change. Carcass weight can be increased by using plenty of concentrated feed, but a more effective method is to limit fattening by limiting energy intake at the finishing phase of the rearing.

Beef quality

Muscle becomes meat or beef after the animal has been slaughtered. Slaughtering causes chemical, physiological and biological changes in the muscle tissue. To prevent harmful changes, the animal and the meat must be handled correctly.

Beef quality consists of several factors:
  • Physiochemical properties: pH, color, sarcomere length, run-off, consistency
  • Chemical properties: Dry matter content, amount of protein, amount of fat
  • Sensory properties: juiciness, flavor, tenderness
Meat becomes stringy and chewy when the myocine and actin filaments of the muscle stick together after death (rigor mortis). Usually carcases are cooled under +7 C before rigor mortis sets in, which causes the muscle to constrict due to cold. To prevent cold constriction the meat may be stimulated with electricity. Once the meat is cooked, the proteins break and the meat becomes tender.

Juiciness means the amount of muscle fluid which is released when the cooked meat is bitten into. It
is related to the amount of fat in the meat, since fat increases the water retention capacity. The largest part, 64-80 %, of beef is water. The water is retained between actin and myocin filaments. Water retention capacity decreases as the pH decreases after slaughtering. The pH of muscle is 7,2, but it drops to 5,6 within 24 hours after death. Fat percentage varies between 2-25 %. 

If the animal has little glycogen in its body right prior to slaughter, the meat does not develop enough lactic acid after slaughtering and the pH does not drop as fast and low as it should. This results in a tar meat, or DFD meat (dark, firm, dry). DFD meat is not used for whole-meat products because it has poor shelf life. 


Friday, 14 February 2014

Beef production: Basics

 Beef production is the production of beef and veal, i.e. the meat from cows, steers, bulls, heifers and calves. First we look at the differences between beef production to the production of other types of meat. Then we discuss the anatomy of meat, the growth of the beef animals and their carcass composition. The different methods of rearing beef cattle are discussed in later posts.

What is beef? Beef is the meat from bovines, that is "cows" of different age, gender and breed. The beef you see in a market comes either from beef production, milk production or from a combined farm with both milk and beef production. In Northern Europe, for instance, nearly 90 % of all beed originates from the dairy industry.

Compared with other animals reared for their meat, cows are relatively inefficient at transforming vegetation into meat protein. Dairy cows produce much protein and energy to their milk, but as meat producers they are even less efficient than beef cows.The chart on the left shows only the energy and protein in edible cuts. Energy in tallow, lard etc is not included.

One can also compare the animal species in terms of how well they utilize nitrogen. Feed N recovery efficiency in the edible weight fraction is defined as the percentage of the N in the animal feed that ends up in the edible portion of the animal. N recovery efficiency is low in beef production, only 8 %, but much higher for pork (~20%) and poultry (~30%). (Oenema et al. 2005)

Growth models and carcass composition

Growth can mean either the actual daily growth of an animal, the extra growth it puts on due to management and feeding, or the increase in edible cuts. For example: A calf grows 1500 grams a day (actual growth). Of  that, 400 grams is due to heavy feeding (extra growth). After the calf is slaughtered one can then calculate backwards how much of the 1500g went to the edible meat (increase in edible cuts).

Growth consists of four types of changes:
  1. Changes in size (live weight)
  2. Changes in appearance (height, diameter of chest...)
  3. Changes in anatomical composition (fat percentage, ...)
  4. Changes in chemical composition (chemical composition of muscles, fat etc)
Change in size, for example the weight, is an inaccurate measurement because it is affected by what the animal has eaten and drank. The weight of the digestive tract of a bovine varies tens of kilos during the day. The weight of a cow inceases most rapidly from birth until 6 months of age, when the growth slows and finally comes to an end at the age of 2-3 years. The model is very simplified, because bones, muscles, connective tissue and nerves have a very different rate of growth. This also affects the third measurement: the anatomical composition. First the animal gains mostly bones and nerves, then muscles and finally fat, all altering the anatomical composition of the carcass.

Daily growth is measured either as the proportion of daily growth to the live weight, i.e. 1500g / 250kg = 0,006 %, or simply as g/day. Final weight of beef breeds varies from 350 kg (a Dexter cow) to 1400 kg (Charolais bull). Bulls grow 10-20 % faster than steers (castrated bulls), while steers grow as fast as heifers (Galbraith and Topps 1982).

Changes in appeareance only describe how the different parts of the animal grow in proportion to one another. For example a calf has tall feet and a shallow chest, while a grown cow has shorter feet and very wide chest.

Chemical changes describe the changes in the composition of the body. The higher the live weight, the more fat there is in a kilo of carcass, and therefore also the relative energy content increases. At the same time the relative portion of crude protein decreases. As with all young animals, first to grow are the bones and nerve tissue, with muscles next and finally body fat. Breed and gender also affect the carcass composition. Steers gain 10-45 % more fat than bulls, and breeds like Angus and Hereford are fatter than for example Limousin and Charolais. Note that breed does NOT affect the composition of the lean (fatless) carcass.

All in all, the growth of an animal is summarized in the picture below (Rumsey 1991).


The anatomy of muscles

30-40 % of the live weight of a bovine consist of skeletal muscles. The quality of edible meat is affected by the chemical, biochemical and physiological qualities of the muscle both before and after slaughter. Growth, feeding, animal handling and meat processing after slaughter also all have an impact on the quality of the meat.For bovines, 30 largest muscles contribute 75 % of the weight of all the muscles. The largest muscle groups are in the pelvic limb (hind quarters) with 28,5 % of live weight, and neck/thorax with 22,4 %.

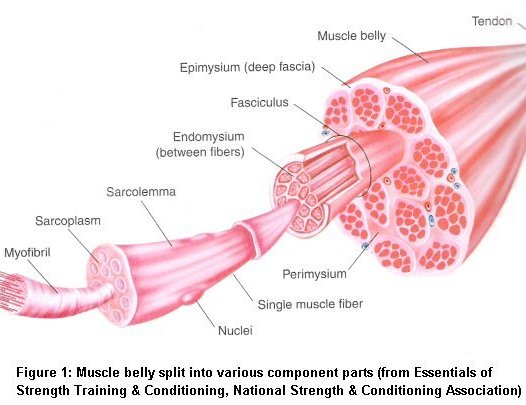
The anatomy of a skeletal muscle is shown in the picture to the left.The muscle is covered by epimysium, and consists of bundles of muscle fibres. The space between bundles is filled with perimysium, which has lots of nerves and blood vessels. Perimysium affects the tenderness of the meat. There is also fat between the muscle fibres, and this fat gives the meat it's marbling properties. Each muscle fibre is surrounded by endomysium, yet another type of membrane.


Each muscle fibre in the skeletal muscles has several nuclei. Fibres are surrounded by a sarcoplasm, which is a membrane, and sarcolemma, which is a type of elastic connective tissue. One fibre consists of 1000-2000 myofibrils. The functional unit of a myofibril is called a sarcomere. Sarcomere is where the muscle actually works, when thick and thin filaments of the sarcomere either slide closer or farther from a z disk (see the picture below). If the filaments become imbricated, the muscle constricts. When they slide farther apart, the muscle relaxes (returns to rest stage) or stretches. A very detailed video about the action potential and muscle activity can be found from Youtube.


Marbling and tenderness

Marbling of the meat means the increase of intramuscular fatty tissue, which occurs at the finishing phase of beef cattle rearing. Marbling is more pronounced with strong, grain-based feeding. The actual level of marbling is determined visually after slaughtering by estimating the percentage of fat in a cut of meat. Fat is seen as white areas in otherwise red meat.

The fat in the muscle is mostly based from de novo -fatty acid synthesis, which takes place in the rumen. The rumen biohydrogenates unsaturated fatty acids into saturated ones, so the fat of ruminating animals is more saturated than that of monogastric animals. For example, cattle have more saturated triglyceride 18:0 and less unsaturated 18:2 than pigs (Lawrence & Fowler: Growth of Farm Animals).

Tenderness is affected by the type of collagen in the perimysium, the connective tissue between bundles of muscle fibres. More important than types or the amount of collagen is cross-linking between the collagen types. Both the cross-linking and insolubility of collagen increase as the animal ages. That is why the meat from old animals is more stringent than the tender meat of young animals. However, when cooking meat in high temperatures even tender meat becomes stringent due to heat-induced chemical changes in the collagen.